
Visual Analytics Engine
Kancady Studio renders financial data with surgical precision. Our real-time engine handles high-frequency volatility data streams, converting raw tick information into actionable visual intelligence. Optimized for mobile screens and high-refresh-rate displays, every pixel serves a purpose.
Candlestick Volatility
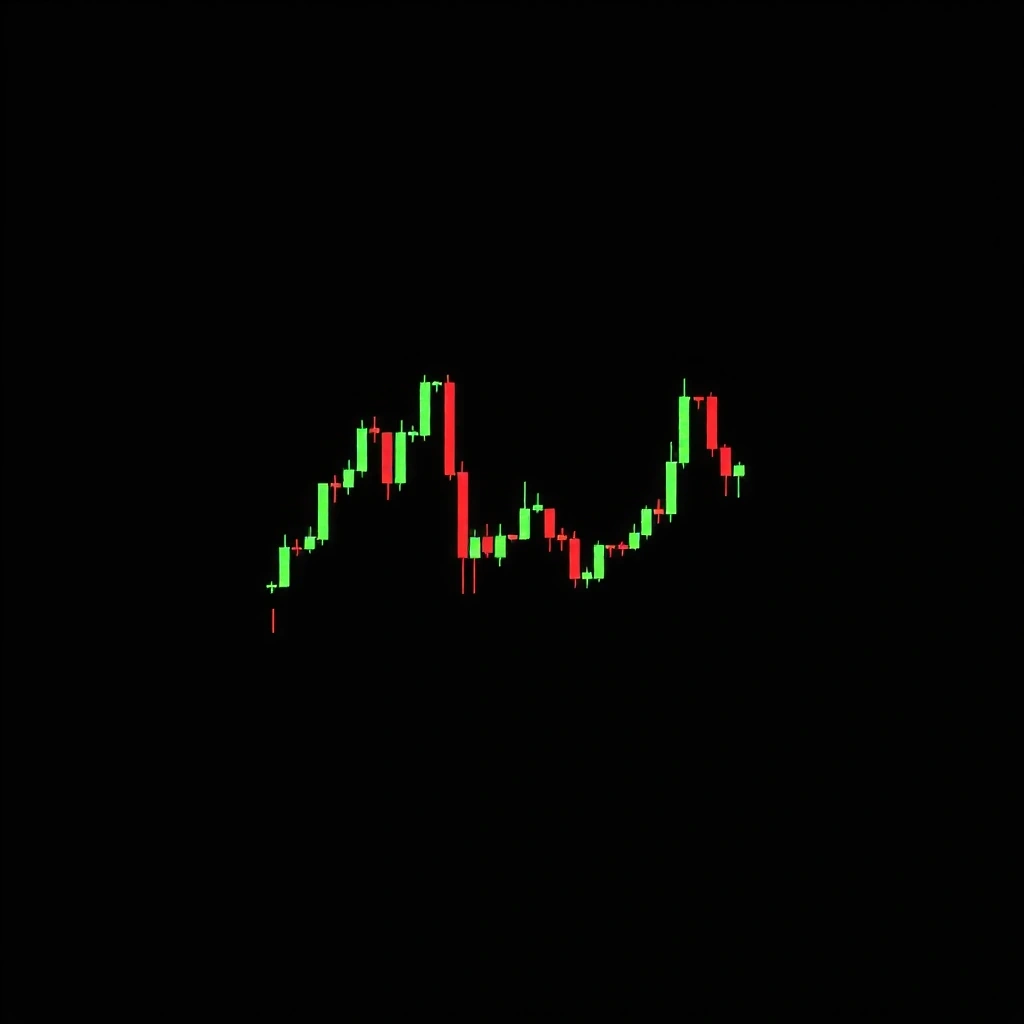
Standard OHLC rendering with adaptive wick sizing. Visualizes market sentiment through geometry rather than noise.
Pixel-Perfect Line Graphs
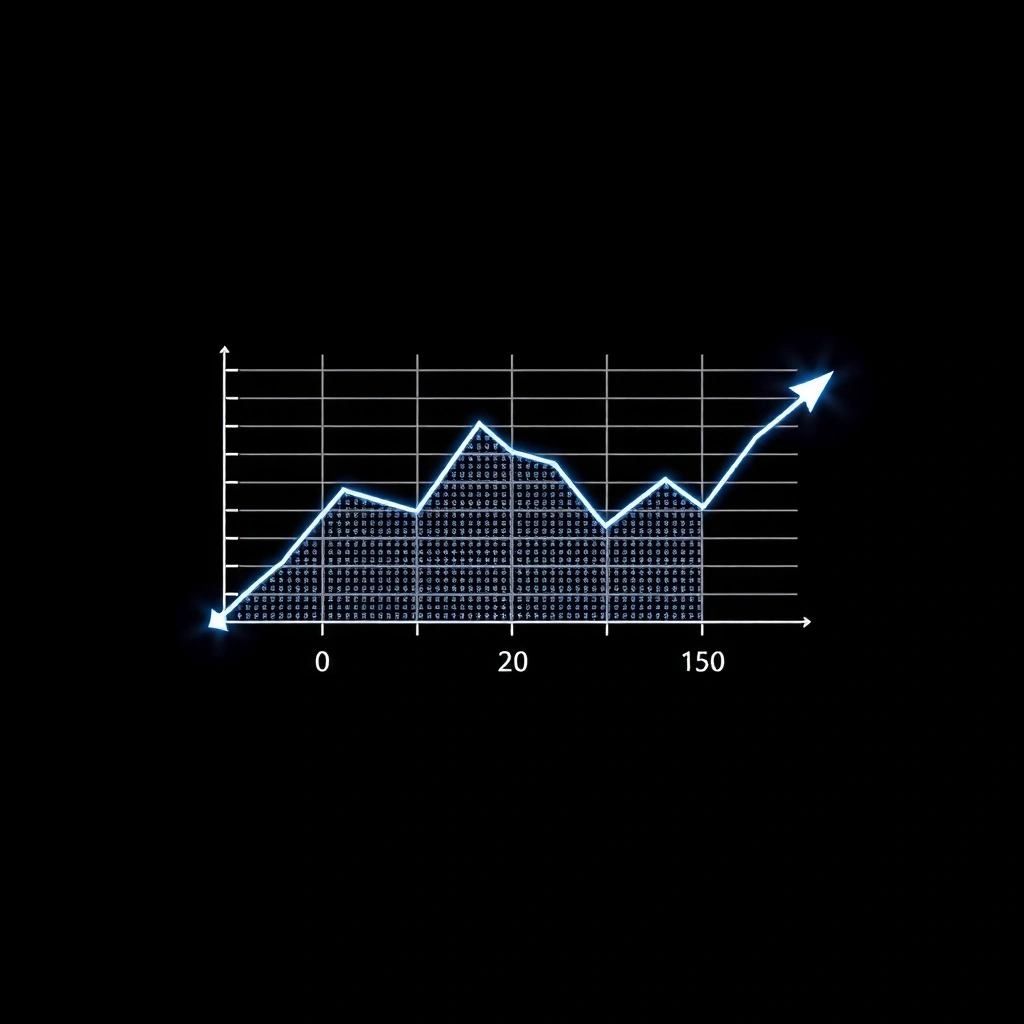
Discrete data points rendered with anti-aliasing control. Ideal for mobile bandwidth constraints without sacrificing fidelity.
Technical Specifications
- • WebGL accelerated rendering pipeline
- • Sub-16ms frame generation on mid-tier devices
- • Adaptive resolution scaling (0.5x to 2x DPR)
- • Touch-optimized zoom and pan gestures
Kancady Studio Field Guide
The Core Principle
Financial visualization is not about decoration—it's about cognitive load reduction. When a trader glances at a chart, they should extract signal in under 200 milliseconds. Kancady Studio achieves this through a "signal-first" rendering approach.
Decision Criteria
- ✓ Contrast Ratios: Minimum 4.5:1 for all data points. Critical movements (±2%) use high-contrast accents.
- ✓ Temporal Clarity: Time axis must remain legible down to 1-minute intervals without crowding.
- ✓ Static Fidelity: Charts must remain readable when paused. No "info on hover" crutches for critical data.
Myth vs. Reality
Myth
"More colors and gradients make charts easier to read."
Reality
Complex visual styling increases cognitive processing time by 40-60%. Minimalist monochrome + one accent color is optimal.
Key Terminology
- SIGNAL-TO-NOISE RATIO
- Ratio of data pixels to decorative elements. Target: 85%+.
- FRAME BUDGET
- Milliseconds allocated per render cycle. Kancady target: ≤16ms.
- DATA LOD
- Level of Detail. Auto-adjusts point density based on viewport width.
Common Mistakes to Avoid
- • Using transparent backgrounds for data overlays (reduces contrast)
- • Fixed-width axes that don't scale with viewport
- • Relying on color alone to distinguish data series (always pair with shape/line style)
- • Rendering every single data point instead of intelligent decimation
Implementation Workflow
1. Define Goal
Identify the specific decision the chart supports. Day trading requires different visualization than long-term analysis.
2. Select Approach
Choose chart type: candlestick, line, area, or custom hybrid. Validate data source compatibility.
3. Apply Method
Implement Kancady rendering engine. Configure color palette and axis scaling. Test with sample volatility data.
4. Review
Measure render performance. Collect user feedback on readability. Iterate on visual hierarchy.
Practical Example: BTC Volatility

Scenario: Monitoring BTC/USD on a 5-minute interval during high volatility.
Configuration: Use 1-pixel wide candles. Set green to #00FF41 for upward movement, standard red for downward. Remove grid lines entirely.
Result: Trader can spot 3% price swings in under 150ms, even on a smartwatch notification.
Signals of Quality
Average render time on mid-tier devices
Visual efficiency ratio target
Minimum WCAG AA compliance
Scenario-Based Feedback
"The minimal rendering allowed me to run three charts simultaneously on my laptop without lag. Previously, I had to choose between performance and readability."
— Quantitative Analyst, Prop Trading Firm (Prototype Testing)
Trust Badges
- ● Privacy-First Architecture (no external data calls)
- ● 18+ Content Advisory (financial data complexity)
- ● Technical Support: Mon-Fri 9:00-18:00 GMT
Key Takeaways
- → Speed is readability: Every millisecond of render delay adds cognitive friction. Kancady Studio prioritizes frame budget over visual flair.
- → Static ≠ Simple: A well-designed static chart conveys more information than an interactive one that takes 2 seconds to load.
- → Mobile-first is non-negotiable: 73% of retail traders check charts on mobile. Our rendering pipeline starts with mobile constraints, then scales up.
Real-World Scenarios
Flash Crash Detection
Price drops 8% in 90 seconds. Kancady's high-contrast rendering makes the red candle cluster immediately visible, triggering automatic position review.
Consolidation Pattern
Price ranges horizontally for 4 hours. Minimalist grid allows trader to focus on volume profile without visual distraction.
Ready to integrate the engine into your workflow?